


By SOVOX Engineering · Published August 18, 2026 · Updated August 24, 2026 · Technical details checked August 24, 2026
The short answer
A spinorama is a standardized way to summarize how a loudspeaker behaves both on axis and around the room. Instead of judging one frequency-response line, read the On-Axis, Listening Window, Early Reflections, Sound Power and Directivity Index curves together.
The fast reading rule is: first look for a smooth direct response, then check whether off-axis behavior changes gradually and predictably. Abrupt divergence between curves can indicate a resonance, diffraction effect or crossover/directivity discontinuity. The goal is not to make every line flat or identical.
What a spinorama is
ANSI/CTA-2034-B is the current Consumer Technology Association standard for measuring loudspeaker frequency response, directivity and maximum output capability. A spinorama commonly refers to the family of curves derived from many angular measurements around a loudspeaker using that methodology.
Its value is context. An on-axis curve tells you what happens in one direction. The additional curves describe a listening area and the sound radiated toward surfaces that will later reflect energy back to the listener.
Primary reference: ANSI/CTA-2034-B — Standard Method of Measurement for In-Home Loudspeakers
Why on-axis response is useful but incomplete
A smooth on-axis response is desirable because it describes the direct sound at the reference axis. But two loudspeakers can have similar on-axis responses and very different off-axis radiation. In a room, those differences affect the spectral balance of early reflections and the reverberant field.

This matters especially at a desk, where the speaker is close to a large reflective surface and often close to a wall. Direct sound is dominant at short distances, but reflected energy still contributes to perceived tonal balance and imaging.
The main spinorama curves

- On-Axis: response at the designated reference axis. Use it to identify broad tonal trends and local response features.
- Listening Window: an average over a defined group of angles near the main axis. It is useful for judging how much response changes with normal head movement.
- Early Reflections: a weighted estimate of sound directed toward typical first-reflection surfaces. It is not a measurement of your specific room.
- Sound Power: total acoustic energy integrated over all directions. It describes the overall radiated spectrum rather than what one listener hears directly.
- Predicted In-Room Response: a weighted estimate derived from the standardized direct and reflected-sound curves. It is useful for comparison, but it is not a prediction of the exact response at your seat in a particular room.
- Directivity Index (DI): the level difference between more forward-directed energy and broader radiated energy. A higher DI generally means the speaker is more directional at that frequency.
How to read the chart in 30 seconds
- Start with On-Axis and Listening Window. Look for broad smoothness and make sure the listening window does not develop a large new feature that is absent on axis.
- Compare Early Reflections and Sound Power. They do not need to match the direct sound in level, but their shapes should change in a reasonably smooth way. Sharp kinks or local divergence deserve investigation.
- Read the DI curves. Directivity normally increases with frequency as wavelengths become shorter relative to the radiating surfaces. A smooth trend is generally easier to integrate with a room than a sudden step.
- Locate any feature by frequency. Then compare it with the crossover frequencies, driver dimensions and separate horizontal/vertical directivity plots.
Why “parallel” is useful — but not a law
You will often hear the advice that spinorama curves should remain roughly parallel as they separate. The idea is useful: if the off-axis spectrum has a similar broad shape to the direct sound, reflections are less likely to introduce a strong new coloration.
But the curves are calculated from different angular averages and are not expected to be exact copies. A loudspeaker naturally becomes more directional through parts of the spectrum, so separation among the curves is normal. What matters is whether the change is smooth, explainable and appropriate for the design, not whether the lines are visually parallel at every frequency.
Directivity Index: what a bump or dip means
A local change in DI means the radiation pattern becomes more or less directional in that region. It does not automatically mean there is an equally large error in the direct sound.
When you see a DI feature, ask four questions:
- Does the same feature appear on axis or in the listening window? If not, it may primarily affect the reflected field.
- Is it broad or narrow? Broad spectral changes are generally more consequential to tonal balance than very narrow ones of the same amplitude.
- Is it smooth or abrupt? A gradual change often reflects normal directivity evolution; a sudden discontinuity may point to crossover or diffraction behavior.
- Does it appear in both horizontal and vertical data? Separate directivity maps help identify whether the effect is axis-specific.
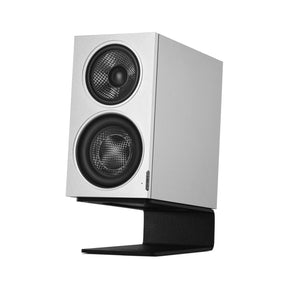
For example, the MiniMax3 data shows a change in directivity around the upper treble. The useful way to judge it is not to hide the feature, but to compare it with the listening window and the separate angular data to understand where it appears and how broad it is.
Reading the early-reflections breakdown

The individual floor, ceiling, side-wall, front-wall and rear-wall components show how radiation differs toward common room surfaces. A forward-radiating speaker should send less high-frequency energy behind itself as frequency rises, so a rear-wall component falling away with frequency is not inherently a problem.
For desktop use, the floor/desk-related and vertical behavior deserve particular attention because a hard surface sits close below the speaker. Separate vertical directivity data can show whether energy changes smoothly through the crossover region.
How the data is measured
CTA-2034 defines the curves and measurement framework; different measurement systems can be used to acquire sufficiently accurate angular data. One common modern approach is the Klippel Near-Field Scanner (NFS), which samples the sound field around a loudspeaker and reconstructs its free-field radiation while mathematically separating much of the room contribution.
SOVOX measured the MiniMax3 design on a Klippel NFS and publishes on-axis, off-axis, spinorama, early-reflections, horizontal/vertical directivity, distortion and placement-control data on the product page.
Disclosure: those are manufacturer measurements. For independent verification, Erin's Audio Corner measured the MiniMax3 Monitor on a separate Klippel NFS. Review unit loaned by SOVOX; the review disclosure states no payment or other compensation.
Common spinorama mistakes
- Ranking speakers by the flattest single line: directivity and listening-window behavior can distinguish speakers with similar on-axis curves.
- Treating Predicted In-Room as your room response: it is a standardized comparative estimate, not a substitute for measuring your actual setup.
- Assuming rising DI is bad: increasing directivity with frequency is normal for most loudspeakers.
- Ignoring the axes and smoothing: graph scale, smoothing and normalization can make the same data look more or less dramatic.
- Reading one local wiggle in isolation: compare the same frequency across on-axis, listening-window, DI and horizontal/vertical plots before drawing a conclusion.
Frequently asked questions
What does “spinorama” mean?
It commonly refers to the standardized family of direct and off-axis loudspeaker curves derived from angular measurements around the speaker, associated with ANSI/CTA-2034 methodology.
Is a flat on-axis response enough?
No. It is an important starting point, but it does not describe how the loudspeaker radiates toward the rest of the room.
What is the most important spinorama curve?
No single curve is sufficient. Start with On-Axis and Listening Window, then use Early Reflections, Sound Power and DI to understand how radiation changes away from the listening axis.
Does Predicted In-Room tell me what my room will measure?
No. It is a standardized weighted estimate useful for comparing loudspeakers. Your actual room response depends on placement, boundaries, dimensions, treatment and listening position.
What does a smooth directivity index tell me?
It suggests that the speaker's radiation pattern changes gradually with frequency rather than abruptly. That usually makes reflected sound easier to reason about, but DI should still be read together with the direct-response curves.
Sources and editorial notes
- Consumer Technology Association — ANSI/CTA-2034-B
- SOVOX MiniMax3 Monitor — manufacturer measurement set
- Erin's Audio Corner — independent MiniMax3 measurement and review
- How to choose a compact studio monitor
Editorial policy: SOVOX manufactures the loudspeaker used in the example plots. Manufacturer data is identified as such and paired with an independent measurement source. Technical explanations follow the current ANSI/CTA-2034-B terminology where applicable.
Share:
Two-Way vs Three-Way Studio Monitors: What Actually Changes
How to Choose a Compact Studio Monitor